箱ひげ図の外れ値
次のコードを実行したときの出力として、正しいものを1つ選べ。
import matplotlib.pyplot as plt
fig, ax = plt.subplots()
res = ax.boxplot([1, 2, 3, 4, 100])
print(len(res["fliers"][0].get_ydata()))- A
0 - B
5 - C
2 - D
1
正解と解説を見る
正解:D
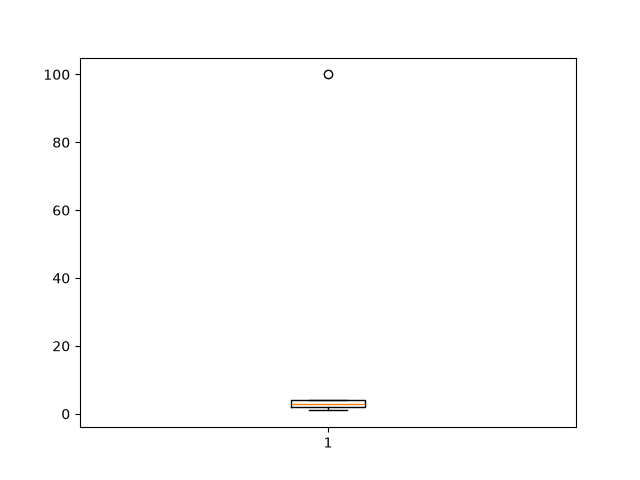
箱ひげ図は、箱が第 1〜第 3 四分位数、中の線が中央値、ひげが 1.5×IQR 以内の範囲で、その外の点は外れ値として描かれる。
| 順 | 実行する行 | 実行後の変数 |
|---|---|---|
| 1 | `import matplotlib.pyplot as plt` | — |
| 2 | `fig, ax = plt.subplots()` | — |
| 3 | `res = ax.boxplot([1, 2, 3, 4, 100])` | res = {'whiskers': [<matplotlib.lines.Line2D … |
| 4 | `print(len(res["fliers"][0].get_ydata()))` | res = {'whiskers': [<matplotlib.lines.Line2D … |
| 結果 | 実際の出力 | 1 |
- A
誤り。100 は外れ値。
- B
誤り。外れ値は 1 つだけ。
- C
誤り。外れ値は 100 だけ。
- D
正しい。100 が外れ値(ひげの範囲の外)として 1 つ描かれる。
このサイトの問題は、各試験の公式に示された出題範囲に沿って作ったオリジナルの模擬問題です。本試験の問題ではありません。一般社団法人Pythonエンジニア育成推進協会の公式サービスではありません。