円グラフ
次のコードを実行したときの出力として、正しいものを1つ選べ。
import matplotlib.pyplot as plt
fig, ax = plt.subplots()
wedges, texts = ax.pie([1, 3])
print(len(wedges), round(wedges[1].theta2 - wedges[1].theta1))- A
2 90 - B
2 180 - C
4 270 - D
2 270
正解と解説を見る
正解:D
ax.pie(値) は、値の割合で円を分ける。角度は 360 度 × 割合。割合の比較には、棒グラフの方が読み取りやすいことも多い。
| 順 | 実行する行 | 実行後の変数 |
|---|---|---|
| 1 | `import matplotlib.pyplot as plt` | — |
| 2 | `fig, ax = plt.subplots()` | — |
| 3 | `wedges, texts = ax.pie([1, 3])` | wedges = [<matplotlib.patches.Wedge object at 0x…, texts = [Text(0.77… |
| 4 | `print(len(wedges), round(wedges[1].theta2 - w…` | wedges = [<matplotlib.patches.Wedge object at 0x… |
| 結果 | 実際の出力 | 2 270 |
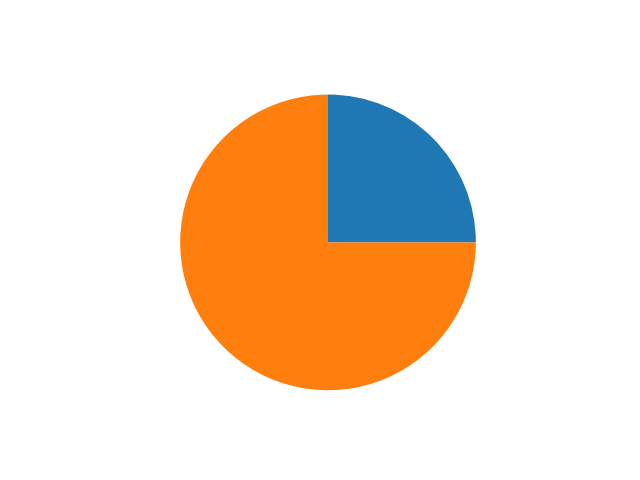
- A
誤り。1 の割合の角度。
- B
誤り。割合が等しいときの角度。
- C
誤り。扇形は 2 つ。
- D
正しい。2 つの扇形で、3 の割合は全体の 3/4 なので 270 度。
このサイトの問題は、各試験の公式に示された出題範囲に沿って作ったオリジナルの模擬問題です。本試験の問題ではありません。一般社団法人Pythonエンジニア育成推進協会の公式サービスではありません。